View and Manage Dashboard
The Workbench Dashboard provides a centralized view of key metrics, analytics, and tools for managing exam data efficiently. It enables users to monitor candidate performance, track exam statistics, and access various psychometric analysis features.
Key Features:
- Exam Performance Insights: View detailed analytics on candidate performance, including pass rates, score distributions, and statistical trends.
- Data Visualization: Graphs and charts for quick interpretation of key psychometric metrics.
- Item Analysis: Evaluate question difficulty, discrimination index, and other psychometric properties.
- Test Reliability & Validity Checks: Assess consistency and accuracy of exam content.
- User-Friendly Navigation: Easily switch between sections for data review, analysis, and report generation.
This dashboard serves as the primary interface for psychometricians and administrators to analyze and optimize test performance.
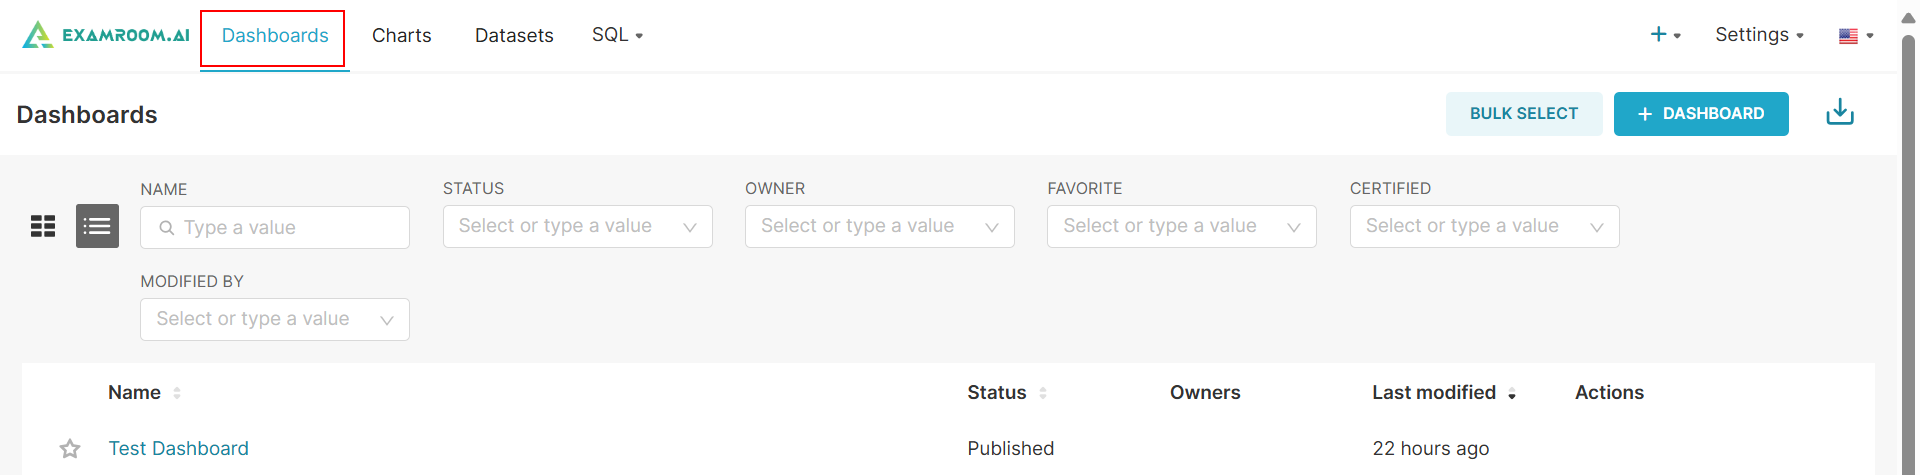
View Dashboard
The dashboard serves as the central hub for accessing key psychometric data and analytics.
- Click Dashboards from the toolbar.
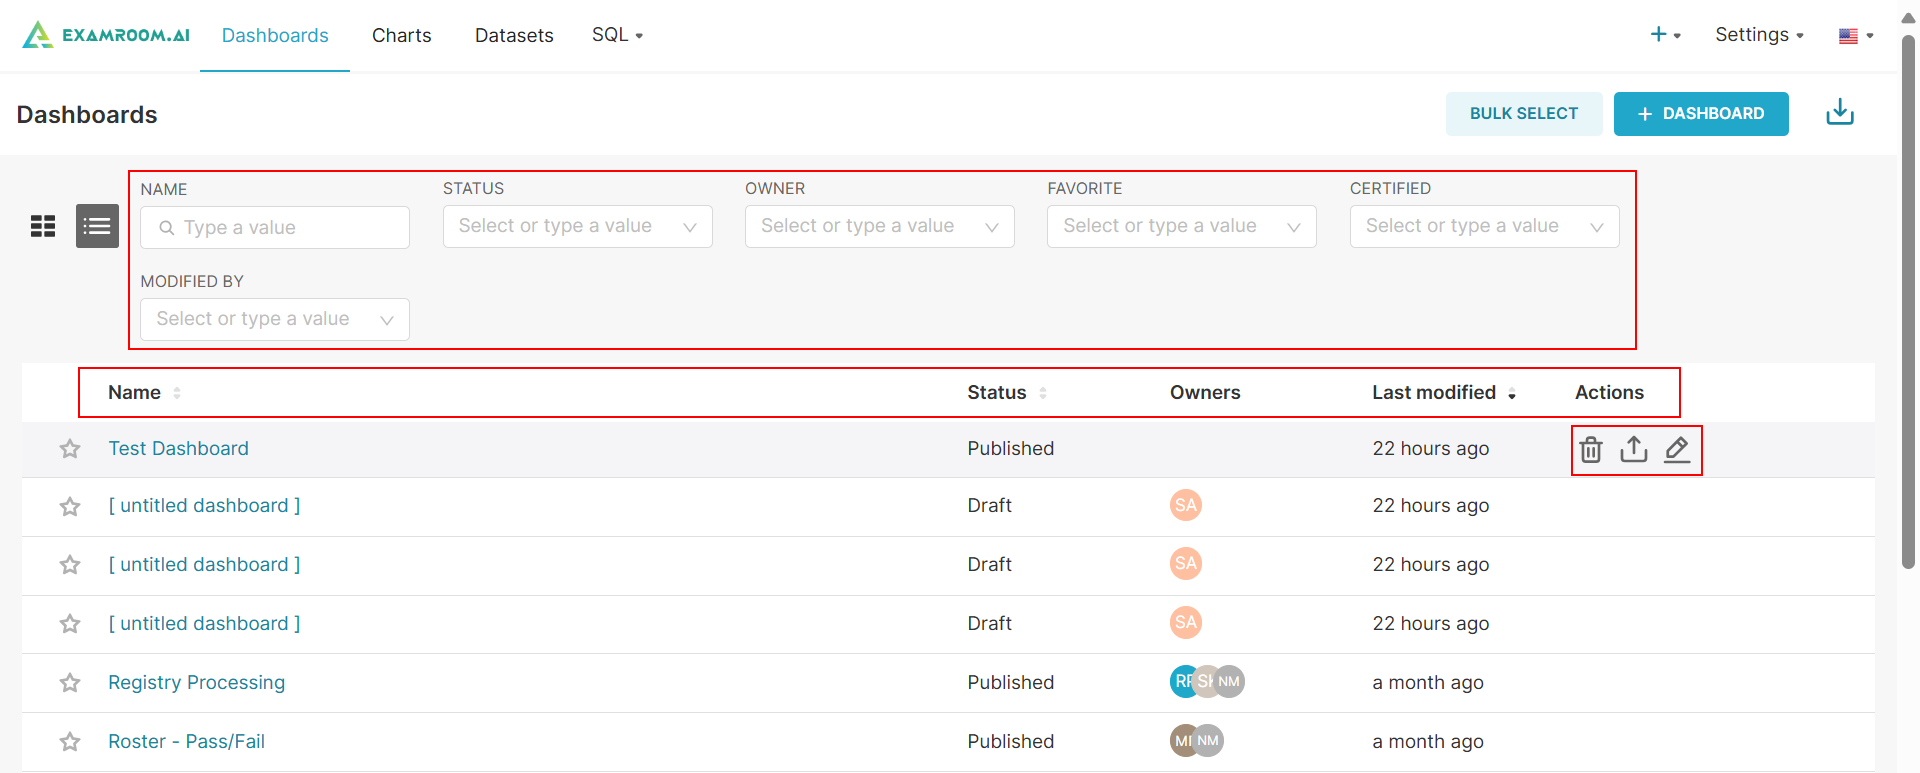
- On the Workbench dashboard, all the created dashboards and workspaces are displayed in a tabular format that includes the following details:
- Name: Displays the title of the project or workspace.
- Status: Indicates the current state (e.g., Active, In Progress, Completed, or Archived).
- Owners: Lists the individuals or teams responsible for managing the workspace.
- Last Modified: Shows the most recent update timestamp, reflecting the latest changes made to the project.
- Action: Take action on the created workspace
- Delete: Remove an existing workspace.
- Export: Export workspace data for external analysis to CSV.
- Edit: Modify workspace details and configurations.